Business & growth
You gave AI a screenshot to fix your frontend. It guessed. Now it doesn't have to.
- AI
- OpenAI
- Codex
- Web development
- Debugging
For months, that was the whole workflow. You shared a capture of the broken UI. The agent proposed a patch—and you hoped it matched what production was actually doing.
That approach is fine for layout tweaks. It is weak for the problems that actually waste afternoons: a slow API call buried in network traffic, a console error that only appears after login, a layout bug that lives in applied styles—not in the pixels a screenshot captures.
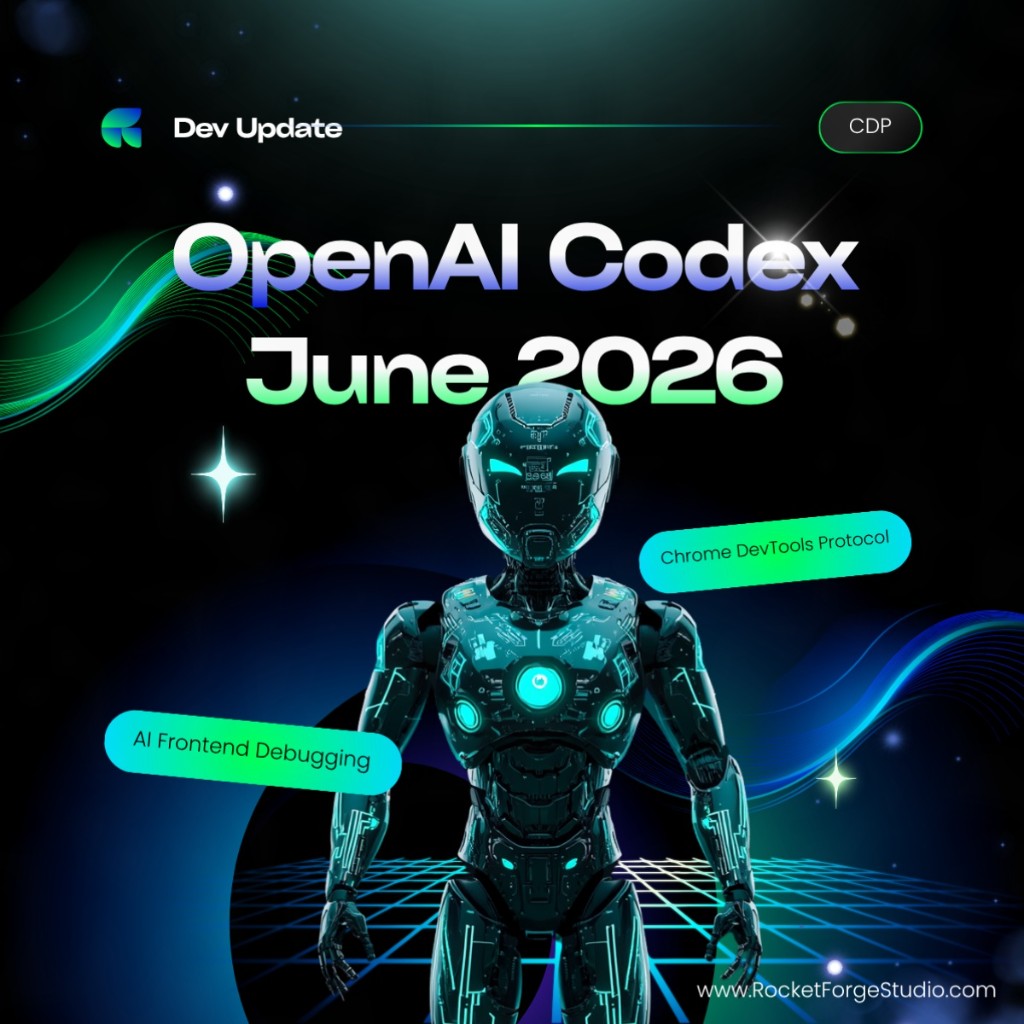
OpenAI's June 2026 update to Codex changes that line. **Developer mode** gives Codex controlled access to the **Chrome DevTools Protocol (CDP)** inside the Codex in-app browser and, with the Codex Chrome extension, in your regular Chrome session. The agent can profile JavaScript performance, read console output, inspect network requests, and examine page state including the DOM and applied styles.
What developer mode actually unlocks
Think of CDP as the same diagnostic layer professional web developers use in Chrome DevTools—exposed to Codex when you need root-cause debugging, not guesswork from a thumbnail.
- **Console output** — runtime errors, warnings, and logs the screenshot never showed
- **Network traffic** — request timing, headers, and payloads behind slow pages
- **JavaScript performance** — profiling that points at real bottlenecks, not vague "make it faster" prompts
- **Page state** — DOM structure, applied styles, and layout context
- **Verification** — confirm a fix in the live page, not only in generated code
OpenAI demonstrated this on a slow chat app: Codex profiled interactions, inspected network requests, shipped fixes, and backed the change with measurements. That workflow is closer to how a human frontend engineer debugs—and farther from "try another CSS tweak and hope."
Where it runs: in-app browser vs Chrome
Codex exposes two entry points, and the choice matters:
- **`@Browser`** — the Codex in-app browser; best for local dev servers, file previews, and public pages without sign-in
- **`@Chrome`** — the Codex Chrome extension; better when you need login state, extensions, or your real browsing context
Enable developer mode under **Settings → Browser → Enable full CDP access**. Reference `@Browser` or `@Chrome` in your task so Codex knows which surface to use. Organization admins can disable the feature entirely via `browser_use_full_cdp_access = false` in `requirements.toml`—worth checking before you plan a team workflow around it.
The security part is not fine print
Full CDP access is labeled elevated risk for a reason. Codex can inspect sensitive browser internals: open tabs, cookies, local storage, network traffic, console output, and live page state. That is powerful for debugging and dangerous in the wrong profile.
OpenAI requires **explicit approval per site** before Codex uses full CDP on a website. Read the site, task, and requested access before you click approve.
Practical rules web teams should adopt on day one:
- Use a **throwaway Chrome profile** for agent debugging—not your personal browser with saved passwords and banking tabs
- Approve **only the origin you are debugging**—not "always allow everything"
- Keep **client production admin panels** out of agent-connected browsers until you have a policy
- Name a **human owner** for any fix Codex ships after CDP inspection—same discipline as any other AI-generated code change
Developer mode does not remove accountability. It gives the agent better eyes. You still own what merges.
What changes for marketing sites and product frontends
Agencies and product teams debugging client sites feel the gap first. A broken form submission, a third-party script slowing Core Web Vitals, a hydration mismatch—these rarely show up in a screenshot alone.
Developer mode pushes AI-assisted web work toward **evidence-based fixes**: read the network waterfall, read the console, profile the interaction, then change code. That is slower than blind codegen and faster than three rounds of "it works on my machine."
It also raises the bar for **review**. When Codex can see console and network data, your team should still verify auth flows, payment paths, and personal data handling manually. Better diagnostics do not replace human judgment on sensitive routes.
A practical first session checklist
You do not need to rebuild your workflow overnight:
- Enable developer mode once in a **test profile**
- Pick one **bounded bug**—a slow interaction, a failing form, a layout shift—not your entire app
- Start with **`@Browser`** on localhost before connecting `@Chrome` to a logged-in staging environment
- When the approval prompt appears, confirm **site + scope** before allowing CDP access
- Ask Codex to **show what it found** in console or network terms—not only the code patch
- Review and **measure after the fix** (load time, error cleared, request count down)
Screenshot debugging was always a ceiling. CDP access is a door—opened deliberately, one site at a time.
The contrarian takeaway
The headline is not "AI replaced Chrome DevTools." The headline is **AI can finally read the same signals DevTools already exposed**—under explicit approval and with real security tradeoffs.
Use throwaway profiles. Approve per site. Keep a human owner on every merge. If you want a second opinion on where agent-assisted debugging fits—or does not fit—your marketing site or product frontend workflow, send a note.